

Blacks see lowest official poverty rate ever in 2022
The official poverty rate of the Black population in the United States fell to historic low of 17.1% in 2022, according to new Census Bureau data released last week.
Estimates from the Current Population Survey Annual Social and Economic Supplement (CPS ASEC) show the Black population was one of the only major demographic groups to experience a significant change in poverty between 2021 and 2022.
The official poverty rate for the nation was 11.5%, unchanged from 2021.
Historic census records have tracked official poverty rates by ethnicity since 1959, when the official poverty rate for Black individuals totaled 55.1%, the highest rate on record.
Poverty rates in 2022 also fell to historic lows for Black children under 18, at 22.3% of the that age group considered impoverished.
The 2022 official poverty rate for Black adults ages 18 to 64 was 14.9%, numerically a historic low (though not statistically different from 2019). The official poverty rate for Black adults 65 and older was 17.6%, not statistically different from 2021.
Racial inequalities persist
Despite falling to historic lows, poverty still impacts people of color most, the Census study also showed.
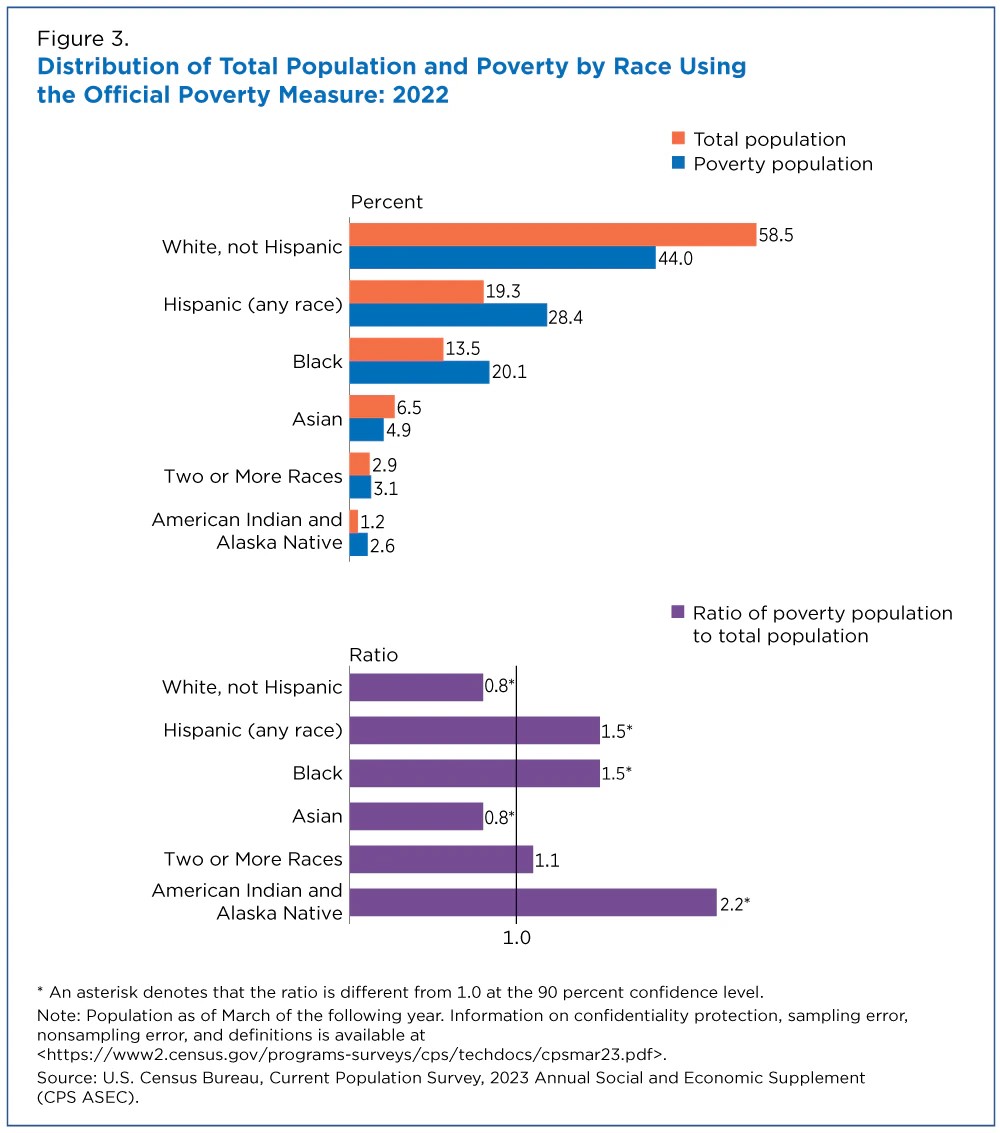
The attached graphic looks at six race and Hispanic origin groups. Comparing the share of a particular group in poverty to that group’s share of the total population shows whether they are underrepresented or overrepresented in poverty.
Groups with ratios of less than 1.0 are underrepresented (their share in poverty is lower than their share of the population), while groups with ratios greater than 1.0 are overrepresented (their share in poverty is higher than their share of the population).
Black individuals made up 20.1% of the population in poverty in 2022, for example, but they were only 13.5% of the total population. This results in a ratio of 1.5, meaning that the Black population was overrepresented in poverty.
The Hispanic population was also overrepresented in poverty (ratio of 1.5). Ratios for the Black and Hispanic populations were not statistically different from one another.
The American Indian and Alaska Native population (ratio of 2.2) was the most overrepresented in poverty.
Non-Hispanic White and Asian individuals were underrepresented in poverty, both with a ratio of 0.8, not statistically different from one another.
The ratio for the Two or More Races population was not statistically different from 1.0, meaning that this group was neither over- nor underrepresented in poverty.
How the Census measures poverty
Each year the Census Bureau releases two measures of poverty: The official poverty measure and the Supplemental Poverty Measure (SPM).
The official poverty measure, available back to 1959, defines poverty by comparing pretax money income to a national poverty threshold adjusted by family size, number of children and age of householder.
The SPM, available back to 2009, extends the official poverty measure by accounting for federal and state taxes, work and medical expenses, geographic variation in housing and several government programs designed to assist low-income families.
While the official poverty measure showed poverty rates declining between 2021 and 2022 for Black individuals, the SPM showed an increase from 11.3% in 2021 to 17.2% in 2022.
This large increase in SPM poverty was due to the expiration of pandemic safety net programs like stimulus payments and expanded refundable tax credits.
These policies contributed to record low SPM rates in 2021 for both the total and Black populations.